引言
WebGIS(网络地理信息系统)是指工作在Web网上的GIS,是传统的GIS在网络上的延伸和发展,具有传统GIS的特点,可以实现空间数据的检索、查询、制图输出、编辑等GIS基本功能,同时也是Internet 上地理信息发布、共享和交流协作的基础。 [1]俗话说」没吃过猪肉还没见过猪跑「,作为WebGIS开发者,不一定非要会 所有的js api ,但最起码要了解,什么样的场景下适合用什么的样的API做开发。
废话不多说,先列出来,本篇文章要讲的四个常见的webGIS JS API。
Openlayers
OpenLayers 是一个高性能、功能丰富的库,用于在 Web 上创建交互式地图。它可以显示从任何来源加载的地图图块、矢量数据和标记。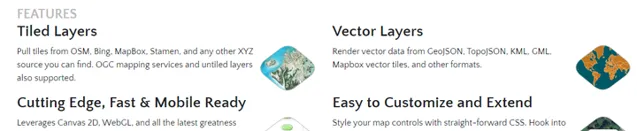
 <!doctype html>
<html lang="en">
 <head>
 <link rel=" stylesheet" href="https://cdn.jsdelivr.net/gh/openlayers/openlayers.github.io@master/en/v6.6.1/css/ol.css" type="text/css">
 < style>
 .map {
 height: 400px;
 width: 100%;
 }
 </ style>
 <script src="https://cdn.jsdelivr.net/gh/openlayers/openlayers.github.io@master/en/v6.6.1/build/ol.js"></script>
 <title>OpenLayers example</title>
 </head>
 <body>
 <p>My Map</p>
 <div id="map" class="map"></div>
 <script type="text/javascript">
 var map = new ol.Map({
 target: 'map',
 layers: [
 new ol.layer.Tile({
 source: new ol.source.OSM()
 })
 ],
 view: new ol.View({
 center: ol.proj.fromLonLat([37.41, 8.82]),
 zoom: 4
 })
 });
 </script>
 </body>
</html>
Leaflet
Leaflet 是用于移动友好型交互式地图的领先开源 JavaScript 库。 JS 的重量仅为 39 KB,它具有大多数开发人员需要的所有映射功能。
<!DOCTYPE html>
<html>
<head>
<title>Quick Start - Leaflet</title>
<meta charset="utf-8" />
<meta name="viewport" content="width=device-width, initial-scale=1.0">
<link rel="shortcut icon" type="image/x-icon" href="docs/images/favicon.ico" />
<link rel=" stylesheet" href="https://unpkg.com/[email protected]/dist/leaflet.css" integrity="sha512-xodZBNTC5n17Xt2atTPuE1HxjVMSvLVW9ocqUKLsCC5CXdbqCmblAshOMAS6/keqq/sMZMZ19scR4PsZChSR7A==" crossorigin=""/>
<script src="https://unpkg.com/[email protected]/dist/leaflet.js" integrity="sha512-XQoYMqMTK8LvdxXYG3nZ448hOEQiglfqkJs1NOQV44cWnUrBc8PkAOcXy20w0vlaXaVUearIOBhiXZ5V3ynxwA==" crossorigin=""></script>
</head>
<body>
<div id="mapid" style="width: 600px; height: 400px;"></div>
<script>
var mymap = L.map('mapid').setView([51.505, -0.09], 13);
L.tileLayer('https://api.mapbox.com/ styles/v1/{id}/tiles/{z}/{x}/{y}?access_token=pk.eyJ1IjoibWFwYm94IiwiYSI6ImNpejY4NXVycTA2emYycXBndHRqcmZ3N3gifQ.rJcFIG214AriISLbB6B5aw', {
maxZoom: 18,
attribution: 'Map data © <a href="https://www.openstreetmap.org/copyright">OpenStreetMap</a> contributors, ' +
'Imagery © <a href="https://www.mapbox.com/">Mapbox</a>',
id: 'mapbox/streets-v11',
tileSize: 512,
zoomOffset: -1
}).addTo(mymap);
</script>
</body>
</html>
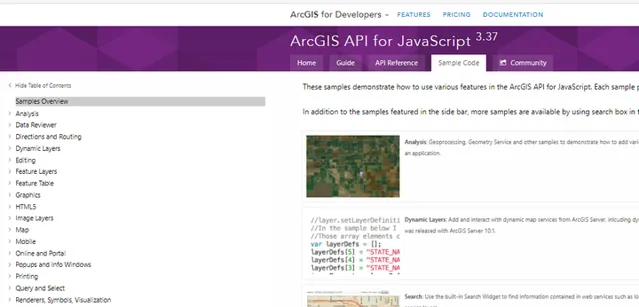
ArcGIS js API

 <!DOCTYPE html>
<html>
 <head>
 <meta http-equiv="Content-Type" content="text/html; charset=utf-8">
 <meta name="viewport" content="initial-scale=1, maximum-scale=1,user-scalable=no"/>
 <title>Simple Map</title>
 <link rel=" stylesheet" href="https://js.arcgis.com/3.37/esri/css/esri.css">
 < style>
 html, body, #map {
 height: 100%;
 margin: 0;
 padding: 0;
 }
 </ style>
 <script src="https://js.arcgis.com/3.37/"></script>
 <script>
 var map;

 require(["esri/map", "dojo/domReady!"], function(Map) {
 map = new Map("map", {
 basemap: "topo", //For full list of pre-defined basemaps, navigate to http://arcg.is/1JVo6Wd
 center: [-122.45, 37.75], // longitude, latitude
 zoom: 13
 });
 });
 </script>
 </head>

 <body>
 <div id="map"></div>
 </body>
</html>
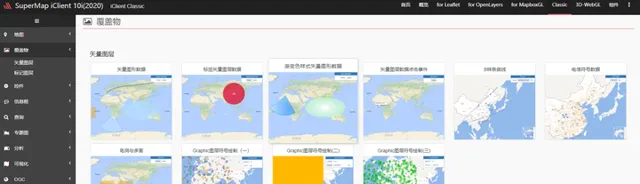
SuperMap iClient JavaScript
superMap作为国内的gis的领头羊,其技术实力还是很强的,尤其是桌面版的软件核心代码从头用c++来进行重写,性能上还是很高的,很看好其发展潜力。 闲话不再多说,言归正传,SuperMap的js api其核心还是前面的讲的leaflet和openlayers等之类的开源代码,它进行了二次封装,详见下图:
 <!DOCTYPE html>
<html>
<head>
<meta charset="UTF-8">
<title data-i18n="resources.title_tiledMapLayer4326"></title>
<script type="text/javascript" src="../js/include-web.js"></script>
<script type="text/javascript" src="../../dist/ol/include-ol.js"></script>
</head>
<body style=" margin: 0;overflow: hidden;background: #fff;width: 100%;height:100%; position: absolute;top: 0;">
<div id="map" style="width: 100%;height:100%"></div>
<script type="text/javascript">
 var map, url = (window.isLocal ? window.server : "https://iserver.supermap.io")+"/iserver/services/map-world/rest/maps/World";
 map = new ol.Map({
 target: 'map',
 controls: ol.control.defaults({attributionOptions: {collapsed: false}})
 .extend([new ol.supermap.control.Logo()]),
 view: new ol.View({
 center: [0, 0],
 zoom: 2,
 projection: 'EPSG:4326',
 multiWorld: true
 })
 });
 var layer = new ol.layer.Tile({
 source: new ol.source.TileSuperMapRest({
 url: url,
 wrapX: true
 }),
 projection: 'EPSG:4326'
 });
 map.addLayer(layer);
 map.addControl(new ol.supermap.control.ScaleLine());
</script>
</body>
</html>

拓展阅读
参考
- ^https://baike.baidu.com/item/webgis/761986?fr=aladdin


